Profile of survival of diffuse intrinsic pontine glioma patients
1 Julho 2018
Diffuse intrinsic pontine gliomas (DIPG), since 2016, can be classified as diffuse midline gliomas H3K27M+ (through histology Histology (from Greek hystos = tissue; logos = study) is the study of animal and plant biological tissues, their formation, structure, and function. In oncology, histopathological examination (sometimes popularly called “biopsy”) is essential to define the type and subtypes of a neoplasm. of surgical biopsy). Regardless of the nomenclature, this is the most frequent malignant glioma Glioma is a tumor of glial cells, which are cells that protect, nourish, and support neurons. Gliomas can occur in the brain, spinal cord, or even along peripheral nerves. They account for about 30% of all central nervous system tumors and 80% of primary malignant brain tumors. Gliomas can be classified as low-grade (generally benign) or high-grade (malignant). In children and adolescents, unlike adults, malignant gliomas are less common. in pediatrics and also the leading cause of death among brain cancers Cancer (from Latin cancer = crab): a large group of very different diseases, all characterized by incessant and disordered cell proliferation, the ability to locally invade healthy tissues, and the ability to spread to distant sites (metastasis). The various types of cancer theoretically originate from a single cell (clonal origin) that has undergone mutations in its genetic code. Learn more here. in children and adolescents.
A study by the Société Internationale d’Oncologie Pédiatrique (SIOP), published in the Journal of Clinical Oncology, showed the profile of children and adolescents who survived DIPG.
To do this, the researchers evaluated 1,130 cases of radiologically confirmed DIPG, treated in Europe and the USA. Of these, 122 cases were excluded. Of the remaining 1,008 cases, 101 (10%) survived more than 2 years (long-term survivors).
Overall survival was 43% at 1 year after diagnosis, 9.6% at 2 years, and 2.2% at 5 years. In the univariate analysis, long-term survivors were more often either under 3 years or over 10 years old, received chemotherapy Chemotherapy refers to the treatment of diseases with chemical substances that affect cell function. It can be antimicrobial, antiviral, anticancer, etc. In common usage, chemotherapy means anticancer or antineoplastic therapy, a cancer treatment using drugs that can induce cell death. Cancer cells are more sensitive to chemotherapy because they multiply rapidly. However, normal cells can also be affected, causing various side effects such as hair loss. or other systemic therapy more frequently, and had a longer duration of symptoms. On the other hand, patients with shorter survival had more cranial nerve paresis, ring enhancement, necrosis, and extrapontine extension.
The authors performed logistic regression analysis to select factors associated with patient survival. They calculated odds ratio (OR) Odds ratio (OR) is a statistical measure that expresses the odds of an event occurring in one group compared to another. In medical studies, an OR greater than 1 suggests higher odds, while an OR less than 1 suggests lower odds for the event in question. The OR is commonly used to compare the chance of an outcome between two groups, such as exposed and non-exposed individuals. and 95% confidence intervals (95% CI). Confidence interval (CI) is a range of values that is likely to contain the true value of a parameter, such as a hazard ratio or odds ratio, with a certain level of confidence (usually 95%). For example, a 95% CI means that if the same study were repeated many times, about 95% of the calculated intervals would contain the true value. A wide CI indicates less certainty about the estimate, while a narrow CI indicates more precision. Long-term survivors were those younger than 3 years or older than 10 years, had longer symptom duration, received systemic therapy, and had the HIST1H3B gene mutation.
These findings are similar to the DIPG survival prediction model proposed in 2015 by Jansen et al. The authors of this model examined a group of 316 DIPG patients treated in the Netherlands and performed a statistical analysis to define prognostic factors that predicted mortality. They performed Cox proportional regression analysis to select variables. They calculated hazard ratios (HR) Hazard ratio (HR) is a statistical measure used in survival analysis to compare the risk of an event (such as death) between two groups over time. An HR greater than 1 means higher risk in the group of interest, while an HR less than 1 means lower risk. The HR expresses how much more (or less) likely the event is to happen in one group compared to another, considering the time until the event occurs. and 95% CI. The factors that showed statistical significance in their analysis (see table below) were included in the final model. This model was used to create a risk score, stratifying patients into standard risk, intermediate risk, and high-risk groups.
In a later study (Veldhuijzen van Zanten et al, 2017), the same group published a validation study of this model analyzing an independent group of 249 DIPG patients. In this case, they could not reproduce the same results as the previous work and the validation failed to show statistical significance for the same predictive factors used, except for treatment with chemotherapy combined with radiotherapy. However, the authors considered the validation of the risk score derived from the model successful, as the patients in the validation group could be statistically significantly stratified into the 3 risk groups. My observation is that, in the Jansen model, the comparison between risk groups was done with univariate analysis, with high significance (p < 0.0001), but without comparison between groups. In the validation, the authors compared the HR between groups, obtaining more modest statistical significance (p < 0.05) only between the standard and high-risk groups. The difference between the intermediate risk group and the other groups was not significant.
So, are these factors important for classifying DIPG patients and predicting their risk? The answer is complicated by the fact that the SIOP study methodology was different from that used to define the Jansen predictive model. Even so, the similarity between the factors is striking. Analyzing the importance of this requires some critical thinking.
First, the factors evaluated in the SIOP study were not chosen randomly, nor were they selected arbitrarily among many others. The authors of the SIOP evaluation used these factors because previous studies, including the Jansen model, had shown their possible importance. In other words, the choice of factors was directed and the similarity between the factors found in different studies is not a coincidence.
Furthermore, one of the most important parameters to be evaluated when analyzing prognostic factors (and one of the most neglected) is the confidence interval. What is this? In short, when we talk about a 95% CI, it means that if we take n random samples from the population being studied, 95% of the means of these samples should fall within the 95% CI. In this particular case, it means that if we repeated the same investigation in 100 different patient groups, approximately the mean of 95 of these repetitions should fall within the calculated 95% CI. In statistics, this is one of the closest points to the truth we can get.
So, let’s look at the 95% CIs of the factors evaluated in the Jansen model and in the SIOP study. In the Jansen model, age greater than or equal to 3 years correlated with an increased HR. As the HR value was almost 2, we can say that the risk of death was almost double in children older than 3 years compared to younger ones. But note the 95% CI, which ranges from 1.01 to 3.8. In the case of an HR of 1.01 (which, by the definition of the 95% CI, we could find in a random repetition of the study), the increased risk in those over 3 years would be only 1%!
- Table 1
| Predictive model factor | HR (95% CI) Jansen | HR (95% CI) Validation | OR (95% CI) SIOP |
|---|---|---|---|
| Age ≥ 3 years | 1.95 (1.01 - 3.8) | 1.29 (0.72 - 1.84) | - |
| Age > 10 years | - | - | 2.24 (1.27 - 3.96) |
| Symptom duration (months) | 0.92 (0.86 - 0.97) | 0.93 (0.85 - 1.01) | - |
| Symptom duration (> 24 weeks) | - | - | 5.7 (2.77 - 14.54) |
| Ring enhancement | 1.41 (1.07 - 1.84) | 1.07 (0.78 - 1.36) | - |
| H3F3A mutation | - | - | 1.14 (1.01 - 1.28) |
| HIST1H3B mutation | - | - | 0.78 (0.67 - 0.91) |
| Chemotherapy | 0.65 (0.49 - 0.99) | 0.51 (0.20 - 0.82) | - |
| Systemic therapy (chemo or other) | - | - | 3 (1.46 - 7.3) |
Table: Predictive factors from the multivariate Jansen model (2015), with hazard ratio (HR) and its 95% CI for mortality risk (the higher the value, the higher the risk). Validation of the Jansen model by Veldhuijzen et al (same predictors). Odds ratio (OR) and its 95% CI for survival (the higher the value, the higher the survival) in the multivariate analysis of the SIOP study.
What can we understand from this? That even though age greater than or equal to 3 years was classified as a predictive factor in the Jansen model, this does not give us much certainty of a large effect! One percent risk does not seem like much, and in this case, it really isn’t. When the 95% CIs of effect measures (such as HR or OR) are very wide, this indicates a lack of certainty in the size of that effect. If we look at the 95% CIs of the HRs in the Jansen model, all are quite wide, indicating that the size of the measured effects can be very variable and even very small.
This can be explained in several ways. The first thing to consider is whether the study methodology was adequate. When it comes to effect measures, it is very important to know if the study had statistical power<p>Statistical power is the probability that a study will detect an effect or difference when one truly exists. High statistical power reduces the risk of false-negative results and increases confidence in the study’s findings.</p> to detect the desired effect. This statistical power is calculated in advance when planning a prospective study. Unfortunately, due to oversight, many studies end up being conducted with low statistical power. This could explain the lack of certainty in the effect size and the very large 95% CI. To fix this, the only way is to repeat the study, this time with adequate statistical power.
Were the studies conducted with sufficient statistical power? These studies were retrospective, so the same statistical power calculation performed in prospective studies is not done. A retrospective or post-hoc statistical power can be calculated, however, this type of calculation may not be informative and can lead to errors in judgment. Thus, for retrospective analyses, statistical power should not be the focus, but rather the confidence intervals. The authors of the studies do not report the statistical power of the analyses performed, except for the validation, which is described as “with slightly low statistical power.”
Another possible explanation for an exaggerated 95% CI and lack of confidence in the observed effect size is the existence of other unknown factors that were not considered and could affect the predictive model. The existence of hidden factors can make a model incomplete and reduce its reliability. How to discover this? Conduct more studies and try to find factors that have not yet been considered.
In the case of the ORs calculated in the SIOP study, the 95% CIs are also quite wide. This would indicate the existence of possible hidden prognostic factors, perhaps more important than those already found, which could complete the current picture. This shows the need for more studies, more research, including basic research to discover new facts that are still unknown today. This is what medical research is for: to help save lives through scientific investigation.
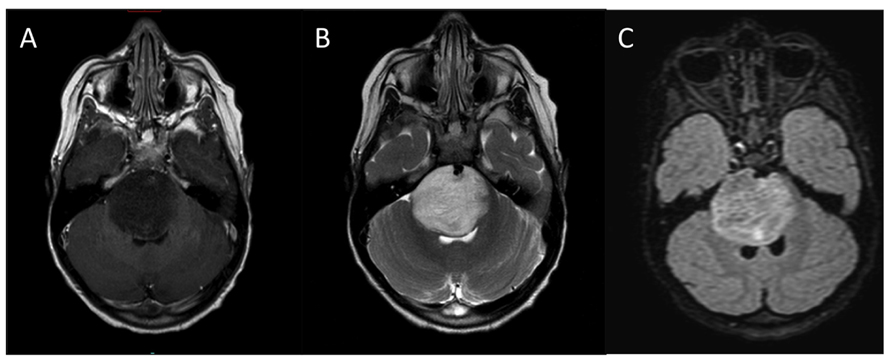
Figure: diffuse intrinsic pontine glioma (MRI image). Credits Katherine E. Warren (2012) CC BY 3.0, via Wikimedia Commons
This post does not represent a treatment suggestion. Only a specialist can judiciously decide which information disclosed may in any way modify a treatment regimen, and how.
Read the SIOP model publication:
- Lindsey M. Hoffman, et al. Clinical, Radiologic, Pathologic, and Molecular Characteristics of Long-Term Survivors of Diffuse Intrinsic Pontine Glioma (DIPG): A Collaborative Report From the International and European Society for Pediatric Oncology DIPG Registries. Journal of Clinical Oncology 2018 36:19, 1963-1972, doi:10.1200/JCO.2017.75.9308
Also read the Jansen model and its validation publications:
- Marc H. Jansen, et al. Survival prediction model of children with diffuse intrinsic pontine glioma based on clinical and radiological criteria. Neuro-Oncology 17(1), 160–166, 2015 doi:10.1093/neuonc/nou104
- Sophie E. M. Veldhuijzen van Zanten, et al. External validation of the diffuse intrinsic pontine glioma survival prediction model: a collaborative report from the International DIPG Registry and the SIOPE DIPG Registry. J Neurooncol (2017) 134:231–240 doi:10.1007/s11060-017-2514-9